b01lers CTF 2026
8804 words | 42 minutes
Yeah, so it’s been a while since I’ve played a CTF, huh? I’ve mostly be caught up organising Singapore’s National Cybersecurity Olympiad and getting really depressed looking at Claire Code one-shotting revs on the Twitter feed. Despite everything, we cringe on.
During this CTF, I was a little too busy getting my shit rocked at the Weatherday gig to compete during the full duration, so I decided to focus my efforts on one of the two low-solve rev challs, and it turned out to be really fun!
In this writeup, I invite you to follow me in the solve process. This isn’t going to be a very clean and structured writeup as I really want to capture the messy, back and forth nature of tackling a challenge like this.
This challenge was solved with 0% Artificial Intelligence and 100% Human Stupidity.
Piano (38 solves / 437 points)
by: oh_word
Description: A sky full of stars
First Blush
Stop saying Ghidra sucks because it doesn’t instantly resolve syscalls. Ghidra has a pre-bundled script called ResolveX86orX64LinuxSyscallsScript.java that does that for you. I know IDA does it automatically, but this isn’t a massive hurdle, guys. Anyways, we run that script to clean up the manual syscalls and get a better idea of what we’re looking at.
The first block is just an argc and strlen check (strlen is reimplemented in FUN_00834300). We know this because we have eyes:
  if (param_1 == 2) {
    puVar10 = (undefined1 *)param_2[1];
    lVar7 = FUN_00834300(puVar10);
    if (lVar7 != 0x24) {
LAB_00401156:
      write(1,"Wrong\n",6);
      puVar9 = puVar9 + 1;
      goto LAB_0040111e;
    }
The actually interesting bit comes immediately after.
    local_148 = 0x11;
    unaff_RBX = syscall_000001B3(local_168,0x58);
    puVar9 = local_2b8 + 1;
    __options = 0;
    if (unaff_RBX != 0) goto LAB_00402888;
    lVar7 = ptrace(PTRACE_TRACEME,0,0);
    puVar9 = local_2b8 + 2;
    if (lVar7 != 0) goto LAB_00401156;
A quick consult of the Linux syscall table tells us syscall_000001B3 is a call to clone3, which the kernel describes as “the extensible successor to clone()/clone2()”. Okay, fancypants. This is a fork(). So we have a parent-child tango going on here, sure. The passthrough right after this is the child’s logic (with the ptrace(PTRACE_TRACEME,0,0))), and the parent’s logic lies in subroutine 0x402888. And we see… more ptrace nonsense…
LAB_00402888:
  _Var2 = (__pid_t)unaff_RBX;
  wait4(_Var2,&local_1a4,__options,(rusage *)0x0);
  ptrace(PTRACE_CONT,unaff_RBX);
  puVar9 = puVar9 + 2;
  while( true ) {
    while( true ) {
      do {
        puVar13 = (undefined1 *)puVar9;
        wait4(_Var2,&local_1a4,0,(rusage *)0x0);
        bVar12 = (byte)(local_1a4 >> 8);
        if ((local_1a4 & 0x7f) == 0) {
                    /* WARNING: Subroutine does not return */
          exit((uint)bVar12);
        }
        puVar9 = (undefined8 *)(puVar13 + 8);
      } while ((short)((local_1a4 & 0xffff) * 0x10001 >> 8) < 0x7f01);
      if (bVar12 != 7) break;
      local_1b0 = &local_108;
      ptrace(PTRACE_GETREGS,unaff_RBX,0,local_1b0,0x3d,0x65);
      ptrace(PTRACE_PEEKTEXT,unaff_RBX,local_88);
...
Nanomites, Son!
So we’ve got nanomites. Here’s the source for my claim. For the uninitiated, this is a nifty anti-debugging technique where you have a strict parent-child relationship: the parent traces the child, and when the child triggers some signal (e.g. hitting a SIGTRAP with an int 3), it hands off execution back to the parent, applies some logic, then returns execution to the child.
How this behaves as effective anti-debugging (besides the fact that dealing with sighandlers are annoying) is that processes can only have one tracer at a time, which means:
- when debugging the parent (which is tracing the child to act as a sighandler and execute additional logic) you cannot debug the child concurrently.
- similarly, if you choose to debug the child, you are disallowing the parent from tracing it, breaking the sighandler logic.
For now, we’ll stick with debugging the parent using gdb and statically analysing the child. We’ve got more logic to look through first, anyways. We’ll tackle this in a better way later.
Signs & Signals
So what signals are we actually catching on the parent’s side?
The relevant code block is here:
  do {
    puVar13 = (undefined1 *)puVar9;
    wait4(_Var2,&local_1a4,0,(rusage *)0x0);
    bVar12 = (byte)(local_1a4 >> 8);
    if ((local_1a4 & 0x7f) == 0) {
                /* WARNING: Subroutine does not return */
      exit((uint)bVar12);
    }
    puVar9 = (undefined8 *)(puVar13 + 8);
  } while ((short)((local_1a4 & 0xffff) * 0x10001 >> 8) < 0x7f01);
  if (bVar12 != 7) break;
...
      if (bVar12 == 0xb) break;
    ptrace(PTRACE_CONT,unaff_RBX,0,(long)(int)(uint)bVar12,0x3d,0x65);
    puVar9 = (undefined8 *)(puVar13 + 0x10);
  }
Looking at the parameters of wait4, we see that local_1a4 is wstatus, which has its status bits defined in waitstatus.h. We can see that our little computation bVar12 = (byte)(local_1a4 >> 8) should extract us the signal number (if local_1a4 & 0x7f is 0, that means the child has exited), and we check whether it’s equal to 0x7 or 0xb, which based on the signal table tells us we’re catching either a SIGBUS or a SIGSEGV.
SIGBUS is one of the less common signals to hit, usually a result of trying to access misaligned addresses or trying to access a valid virtual address that has no physical backing memory (this is an interesting point that we will inspect further later!).
After we catch and identify that we’ve struck a SIGBUS, we continue execution and call these two ptrace functions:
ptrace(PTRACE_GETREGS,unaff_RBX,0,local_1b0,0x3d,0x65);
ptrace(PTRACE_PEEKTEXT,unaff_RBX,local_88);
This is very traditional nanomites behaviour. PTRACE_GETREGS will fetch us the current registers of the child in a gigantic struct:
[1m[38;5;240m─────────────────────────────────────────────────────────────────────────────────── [0m[36mcode:x86:64[1m[38;5;240m ────[0m
[1m[38;5;240m 0x40292e mov r10, rax[0m
[1m[38;5;240m 0x402931 mov rax, r9[0m
[31m●[39m [1m[38;5;240m 0x402934 syscall [0m
[32m→ 0x402936 mov edi, 0x1[39m
0x40293b mov rdx, QWORD PTR [rbp-0x80]
0x40293f lea r10, [rbp-0x198]
0x402946 mov rax, r9
0x402949 syscall
0x40294b lea rsi, [rbp-0x190]
[1m[38;5;240m─────────────────────────────────────────────────────────────────────────────────────── [0m[36mthreads[1m[38;5;240m ────[0m
[[32m#0[39m] Id 1, Name: "chal", [31mstopped[39m [34m0x402936[39m in [33m??[39m (), reason: [35mSINGLE STEP[39m
[1m[38;5;240m───────────────────────────────────────────────────────────────────────────────────────── [0m[36mtrace[1m[38;5;240m ────[0m
[[32m#0[39m] 0x402936 → [31mmov edi, 0x1[39m
[[35m#1[39m] 0x83272f → [31mmov edi, eax[39m
[1m[38;5;240m────────────────────────────────────────────────────────────────────────────────────────────────────[0m
[1m[32mgef➤ [0mx/20gx 0x00007fffffffdd90
[34m0x7fffffffdd90[39m: 0x00007ffff7ff5000 0xffffffffffffffff
[34m0x7fffffffdda0[39m: 0x00007ffff7ff40c0 0x00007fffffffe20b
[34m0x7fffffffddb0[39m: 0x00007fffffffde90 0x00007ffff7ff40b0
[34m0x7fffffffddc0[39m: 0x00000000000001ec 0x00007ffff7ff440c
[34m0x7fffffffddd0[39m: 0x0000000000000000 0x00007ffff7ff4280
[34m0x7fffffffdde0[39m: 0x0000000000000061 0x0000000000000080
[34m0x7fffffffddf0[39m: 0x0000000000000004 0x0000000000000062
[34m0x7fffffffde00[39m: 0x00007ffff7ff4040 0xffffffffffffffff
[34m0x7fffffffde10[39m: 0x0000000000403718 0x0000000000000033
[34m0x7fffffffde20[39m: 0x0000000000010246 0x00007fffffffdbd8
[1m[32mgef➤ [0m
and PTRACE_PEEKTEXT gets us the 8 bytes at the address pointed to by local_88, which in this case is [rbp-0x80] == 0x7fffffffde10, which is the value of rip from the child:
[1m[38;5;240m─────────────────────────────────────────────────────────────────────────────────── [0m[36mcode:x86:64[1m[38;5;240m ────[0m
[1m[38;5;240m 0x40293f lea r10, [rbp-0x198][0m
[1m[38;5;240m 0x402946 mov rax, r9[0m
[31m●[39m [1m[38;5;240m 0x402949 syscall [0m
[32m→ 0x40294b lea rsi, [rbp-0x190][39m
0x402952 mov rdi, r10
0x402955 mov QWORD PTR [rbp-0x1b8], r10
0x40295c call 0x402c60
0x402961 mov rdi, QWORD PTR [rbp-0x1b8]
0x402968 mov DWORD PTR [rbp-0x1b0], eax
[1m[38;5;240m─────────────────────────────────────────────────────────────────────────────────────── [0m[36mthreads[1m[38;5;240m ────[0m
[[32m#0[39m] Id 1, Name: "chal", [31mstopped[39m [34m0x40294b[39m in [33m??[39m (), reason: [35mSINGLE STEP[39m
[1m[38;5;240m───────────────────────────────────────────────────────────────────────────────────────── [0m[36mtrace[1m[38;5;240m ────[0m
[[32m#0[39m] 0x40294b → [31mlea rsi, [rbp-0x190][39m
[[35m#1[39m] 0x83272f → [31mmov edi, eax[39m
[1m[38;5;240m────────────────────────────────────────────────────────────────────────────────────────────────────[0m
[1m[32mgef➤ [0mx/gx $r10
[34m0x7fffffffdcf8[39m: 0x45663667b60f4566
[1m[32mgef➤ [0m
We can see that this corresponds with the bytes at 0x403718 in the binary:
...
    LAB_00403718
    00403718 66 45 0f        MOVZX      R12W,byte ptr [R15 + 0x36]
              b6 67 36
...
This also tells us that our child first triggers a SIGBUS on this instruction. Interesting! Anyways, we cringe on with our parent analysis. After fetching the current instruction from the child, we pass that into FUN_00402c60:
...
    local_1c0 = local_1a0;
    *(undefined8 *)(puVar13 + 0x10) = 0x402961;
    uVar3 = FUN_00402c60(local_1a0,local_198);
    puVar10 = local_1c0;
    local_1b8 = CONCAT44(local_1b8._4_4_,uVar3);
    *(undefined8 *)(puVar13 + 0x10) = 0x402973;
...
This is a really fucking big function (about 480 LOC in the decompilation) and it’s not immediately clear what it’s doing. Now that we’re doing this writeup, I can confidently say that it’s an instruction parser, with the numerous if/switch statements in place to determine opcode parameters. However, note the following:
...
        00402955 4c 89 95        MOV        qword ptr [RBP + local_1c0],R10
                 48 fe ff ff
        0040295c e8 ff 02        CALL       FUN_00402c60
                 00 00
        00402961 48 8b bd        MOV        RDI,qword ptr [RBP + local_1c0]
                 48 fe ff ff
        00402968 89 85 50        MOV        dword ptr [RBP + local_1b8],EAX
                 fe ff ff
        0040296e e8 8d 02        CALL       FUN_00402c00
                 00 00
...
In the actual program, we only concern ourselves with the final return value of FUN_00402c60, which we can sort of eyeball the computation of at the very end of the function:
...
  bVar4 = (char)pbVar17 - (char)param_1;
  (*param_2)[0] = bVar4;
joined_r0x0040300b:
  if (0xf < bVar4) {
    *(uint *)(param_2[2] + 1) = *(uint *)(param_2[2] + 1) | 0x5000;
    (*param_2)[0] = 0xf;
    return 0xf;
  }
  return bVar4;
}
pbVar17 is the working variable for most of the function, and through a bit of guesswork, we can determine that the return value of this function is the length of the instruction parsed. At least for the instruction at 0x403718, we do get the value 0x6 out of this function, so… let’s just wing it?
We then use this length value and the actual instruction bytes (again from [rbp-0x80]) and pass it into FUN_00402c00, which is a lot easier to trace.
A Cool Antidecompilation Trick
Let’s look at the decompilation of FUN_00402c00.
      undefined FUN_00402c00()
      FUN_00402c00

      PUSH       RBX
      PUSH       RAX
      XOR        RBX,RBX
      XOR        RBX,0x1
      CALL       LAB_00402c0e

      LAB_00402c0e

      XOR        RBX,0x1
      CMP        RBX,0x1
      JZ         LAB_00402c3a
      MOVZX      EAX,byte ptr [RDI + 0x1]
      SHR        AL,0x2
      AND        AL,0x1
      TEST       AL,AL
      PUSH       RBX
      LEA        RAX,[FUN_004037d0]
      LEA        RBX,[FUN_00403800]
      CMOVZ      RAX=>FUN_00403800,RBX
      POP        RBX
      RET

      LAB_00402c3a

      POP        RSI
      MOVZX      EAX,byte ptr [RDI]
      XOR        EDX,EDX
      DIV        ESI
      MOVZX      EAX,byte ptr [RDI + RDX*0x1]
      TEST       AL,0x4
      LEA        RAX,[FUN_00403770]
      LEA        RBX,[FUN_004037a0]
      CMOVZ      RAX=>FUN_004037a0,RBX
      POP        RBX
      RET
I’m deliberately avoiding using the decompilation because the finer logic gets lost in it. Knowing that rdi holds our instruction bytes and rsi holds the instruction length, we can see some interesting logic here.
It seems like rbx is here to break the decompilation. The use of call here is very deliberate: the subroutine LAB_00402c0e ends with a ret, which the decompiler believes is the end of the function, and the cmp would never clear, so the jump to LAB_00402c3a doesn’t strike.
To help follow along, we can annotate the value of rbx:
        undefined FUN_00402c00()
        FUN_00402c00

        PUSH       RBX
        PUSH       RAX
        XOR        RBX,RBX ; RBX = 0
        XOR        RBX,0x1 ; RBX = 1
        CALL       LAB_00402c0e

        LAB_00402c0e

        XOR        RBX,0x1 ; RBX = 0
        CMP        RBX,0x1 ; RBX = 0, CMP FAILS
        JZ         LAB_00402c3a
This makes the decompilation end prematurely:
/* WARNING: Removing unreachable block (ram,0x00402c3a) */
/* WARNING: Removing unreachable block (ram,0x00402c58) */
/* WARNING: Removing unreachable block (ram,0x00402c5c) */

code * FUN_00402c00(long param_1)

{
  code *pcVar1;

  pcVar1 = FUN_004037d0;
  if ((*(byte *)(param_1 + 1) >> 2 & 1) == 0) {
    pcVar1 = FUN_00403800;
  }
  return pcVar1;
}
Note the Ghidra comments on removing 0x402c3a, which it treats as unreachable!
However, since we call the subroutine, once it completes, it will return to the xor rbx, 0x1, clearing it out and making the jump pass!
LAB_00402c0e

        XOR        RBX,0x1 ; now RBX = 1 on the rerun
        CMP        RBX,0x1 ; RBX = 1, CMP PASSES!
        JZ         LAB_00402c3a
This is really, really nifty!
The first block is actually there to just fuck with us; both FUN_004037d0 and FUN_00403800 will never be called, and they deceptively look like win/loss conditions:
void FUN_004037d0(int param_1)
{
  if (param_1 != 0xa539f) {
    return;
  }
  write(1,"Correct!\n",9);
                    /* WARNING: Subroutine does not return */
  exit(0);
}


void FUN_00403800(void)
{
  return;
}
How sneaky. Well now we know subroutine LAB_00402c3a is where the actual logic lies, where tracing the assembly looks like such:
- Take the first byte of the instruction we’re parsing (
movzx eax,byte ptr [rdi]) - Divide it by the length of the instruction (
div esi) - Use the remainder, stored in
rdx, to pluck a different byte of the instruction (movzx eax,byte ptr [rdi + rdx*0x1]) - Check whether it has the third bit set high (
test al, 0x4) - If it is 0, load the address
0x4037a0intorax, else load0x403770
The two addresses that can be loaded into rax are both short functions:
void FUN_00403770(undefined8 *param_1)
{
  code *pcVar1;
  undefined8 *puVar2;

  puVar2 = (undefined8 *)thunk_FUN_00833cd0(8);
  *puVar2 = *param_1;
  *param_1 = puVar2;
  syscall_0000000F();
                    /* WARNING: Does not return */
  pcVar1 = (code *)invalidInstructionException();
  (*pcVar1)();
}

void FUN_004037a0(undefined8 *param_1)
{
  undefined8 *puVar1;
  code *pcVar2;

  puVar1 = (undefined8 *)*param_1;
  *param_1 = *puVar1;
  thunk_FUN_00832d30(puVar1);
  syscall_0000000F();
                    /* WARNING: Does not return */
  pcVar2 = (code *)invalidInstructionException();
  (*pcVar2)();
}
Hang on, is that syscall(0xf)? Isn’t that rt_sigreturn of SROP fame? Huh? Let’s put a pin on that… let’s wrap up the parent logic first.
After calling FUN_00402c00, we then seem to set up our register struct to restore the child’s state, indicative by the PTRACE_SETREGS call:
    puVar1 = DAT_00837248;
    puVar9 = DAT_00837248 + 1;
    *DAT_00837248 = 0;
    puVar1[0x3f] = 0;
    uVar11 = (ulong)(((int)puVar1 - (int)(undefined8 *)((ulong)puVar9 & 0xfffffffffffffff8)) +
                      0x200U >> 3);
    puVar9 = (undefined8 *)((ulong)puVar9 & 0xfffffffffffffff8);
    for (; uVar11 != 0; uVar11 = uVar11 - 1) {
      *puVar9 = 0;
      puVar9 = puVar9 + (ulong)bVar18 * -2 + 1;
    }
    puVar1[8] = uStack_d0;
    puVar1[9] = local_d8;
    puVar1[6] = uStack_c0;
    puVar1[7] = local_c8;
    puVar1[10] = puStack_f0;
    puVar1[0xb] = local_f8;
    puVar1[0xe] = local_98;
    puVar1[0xf] = uStack_a0;
    puVar1[0x10] = local_e8;
    puVar1[0x11] = uStack_e0;
    puVar1[0xc] = uStack_100;
    puVar1[0xd] = local_108;
    puVar1[0x12] = local_a8;
    puVar1[0x13] = local_b8;
    puVar1[0x14] = uStack_b0;
    puVar1[0x15] = uStack_70;
    puVar1[0x16] = (local_1b8 & 0xffffffff) + local_88;
    puVar1[0x17] = local_78;
    *(short *)(puVar1 + 0x18) = (short)local_80;
    *(short *)((long)puVar1 + 0xc2) = (short)local_38;
    *(short *)((long)puVar1 + 0xc4) = (short)local_40;
    puStack_f0 = puVar1 + 1;
    local_88 = lVar7;
    ptrace(PTRACE_SETREGS,unaff_RBX,0);
    ptrace(PTRACE_CONT);
    puVar9 = (undefined8 *)(puVar13 + 0x28);
Notice the assignment puVar1[0x16] = (local_1b8 & 0xffffffff) + local_88, which through debugging, shows us that we are updating the child’s rip to advance past the SIGBUS instruction by adding the parsed length:
[1m[38;5;240m─────────────────────────────────────────────────────────────────────────────────── [0m[36mcode:x86:64[1m[38;5;240m ────[0m
[1m[38;5;240m 0x402a2b movups XMMWORD PTR [rdx+0x78], xmm6[0m
[1m[38;5;240m 0x402a2f shufpd xmm1, xmm1, 0x1[0m
[1m[38;5;240m 0x402a34 movups XMMWORD PTR [rdx+0x58], xmm1[0m
[31m●[32m→ 0x402a38 add rax, QWORD PTR [rbp-0x80][39m
0x402a3c movups XMMWORD PTR [rdx+0x88], xmm0
0x402a43 movq xmm0, rax
0x402a48 mov rax, QWORD PTR [rbp-0x78]
0x402a4c movhps xmm0, QWORD PTR [rbp-0x70]
0x402a50 movups XMMWORD PTR [rdx+0x98], xmm4
[1m[38;5;240m─────────────────────────────────────────────────────────────────────────────────────── [0m[36mthreads[1m[38;5;240m ────[0m
[[32m#0[39m] Id 1, Name: "chal", [31mstopped[39m [34m0x402a38[39m in [33m??[39m (), reason: [35mBREAKPOINT[39m
[1m[38;5;240m───────────────────────────────────────────────────────────────────────────────────────── [0m[36mtrace[1m[38;5;240m ────[0m
[[32m#0[39m] 0x402a38 → [31madd rax, QWORD PTR [rbp-0x80][39m
[[35m#1[39m] 0x83272f → [31mmov edi, eax[39m
[1m[38;5;240m────────────────────────────────────────────────────────────────────────────────────────────────────[0m
[1m[32mgef➤ [0mx/wx $rbp-0x80
[34m0x7fffffffde10[39m: 0x00403718
[1m[32mgef➤ [0mp $rax
[36m$5[39m = 0x6
[1m[32mgef➤ [0m
I’m really glad that Ghidra’s support for SSE instructions is really good because reading the diassembly for this SUCKS but it’s turned into nice array assignments in the decompilation.
Now, right at the handoff back to the child, we know should expect to see the advanced rip when it restores its state:
[1m[38;5;240m─────────────────────────────────────────────────────────────────────────────────── [0m[36mcode:x86:64[1m[38;5;240m ────[0m
[1m[38;5;240m 0x402a85 mov QWORD PTR [rbp-0xe8], rdx[0m
[1m[38;5;240m 0x402a8c mov r10, QWORD PTR [rbp-0x1a8][0m
[1m[38;5;240m 0x402a93 mov rdx, r12[0m
[31m●[32m→ 0x402a96 syscall [39m
0x402a98 xor r10d, r10d
0x402a9b mov edi, 0x7
0x402aa0 mov rax, r9
0x402aa3 syscall
0x402aa5 mov r8d, 0x3d
[1m[38;5;240m─────────────────────────────────────────────────────────────────────────────────────── [0m[36mthreads[1m[38;5;240m ────[0m
[[32m#0[39m] Id 1, Name: "chal", [31mstopped[39m [34m0x402a96[39m in [33m??[39m (), reason: [35mBREAKPOINT[39m
[1m[38;5;240m───────────────────────────────────────────────────────────────────────────────────────── [0m[36mtrace[1m[38;5;240m ────[0m
[[32m#0[39m] 0x402a96 → [31msyscall [39m
[[35m#1[39m] 0x83272f → [31mmov edi, eax[39m
[1m[38;5;240m────────────────────────────────────────────────────────────────────────────────────────────────────[0m
[1m[32mgef➤ [0mx/20gx $r10
[34m0x7fffffffdd90[39m: 0x00007ffff7ff5000 0xffffffffffffffff
[34m0x7fffffffdda0[39m: 0x00007ffff7ff40c0 0x00007ffff7ff6008
[34m0x7fffffffddb0[39m: 0x00007fffffffde90 0x00007ffff7ff40b0
[34m0x7fffffffddc0[39m: 0x00000000000001ec 0x00007ffff7ff440c
[34m0x7fffffffddd0[39m: 0x0000000000000000 0x00007ffff7ff4280
[34m0x7fffffffdde0[39m: 0x0000000000000061 0x0000000000000080
[34m0x7fffffffddf0[39m: 0x0000000000000004 0x0000000000000062
[34m0x7fffffffde00[39m: 0x00007ffff7ff4040 0xffffffffffffffff
[34m0x7fffffffde10[39m: 0x0000000000403770 0x0000000000000033
[34m0x7fffffffde20[39m: 0x0000000000010246 0x00007fffffffdbd8
[1m[32mgef➤ [0m
Wait, what the fuck? Remember that 0x7fffffffde10 holds our rip, so we’re updating the child’s rip to one of those rt_sigreturn functions. Huh?
To Cure a Weakling Child
Okay, things are getting silly. We’ve more or less traced out the parent logic, we’ve got a few things to go back to later… let’s look at the child for a bit.
After the PTRACE_TRACEME call (trace me! trace me!) this is followed up by a bunch of calls to FUN_004036d0
  lVar7 = ptrace(PTRACE_TRACEME,0,0);
  puVar9 = local_2b8 + 2;
  if (lVar7 != 0) goto LAB_00401156;
  _Var2 = getpid();
  kill(_Var2,0x13);
  local_2b8[3] = 0x4011e0;
  local_268 = FUN_004036d0();
  local_2b8[3] = 0x4011ec;
  local_280 = FUN_004036d0();
  local_2b8[3] = 0x4011f8;
  local_1b8 = FUN_004036d0();
Who Needs FLIRT When You Have Your Fucking Eyes
FUN_004036d0 is actually just a handoff call to FUN_00833cd0 with the argument 0x8, and once again we are blasted with a hard to interpret decompilation. This almost feels like something that should be FLIRT’d…
Something to observe though is this funny numeric constant in the function:
...
    uVar2 = uVar2 | uVar2 >> 8;
    iVar9 = (char)(&DAT_00835040)[(~uVar2 & uVar2 + 1) * 0x76be629 >> 0x1b] * 4;
    uVar2 = iVar9 - 4;
    if (*(ushort *)(&DAT_008350a0 + (long)(iVar9 + -3) * 2) < uVar8) {
      uVar2 = iVar9 - 2;
    }
    uVar10 = (ulong)uVar2;
...
Googling 0x76be629 tells us that’s a De Bruijn sequence magic constant?? And there’s some Japanese article talking about it’s use in Microsoft’s mimalloc implementation (do give it a read, this is some cool fucking tech).
Could it be that we’re looking at some sort of malloc function?
We can switch over to debugging the child for a bit and just spoof the ptrace check so we can see how this function plays:
[1m[38;5;240m────────────────────────────────────────────────────────────────────────────────────────────────────[0m
[1m[32mgef➤ [0mset follow-fork-mode child
[1m[32mgef➤ [0mb *0x4011e0
Breakpoint 7 at [34m0x4011e0[39m
[1m[32mgef➤ [0m
...
[1m[38;5;240m─────────────────────────────────────────────────────────────────────────────────── [0m[36mcode:x86:64[1m[38;5;240m ────[0m
[1m[38;5;240m 0x4011d4 mov eax, 0x3e[0m
[1m[38;5;240m 0x4011d9 syscall [0m
[31m●[39m [1m[38;5;240m 0x4011db call 0x4036d0[0m
[31m●[32m→ 0x4011e0 mov QWORD PTR [rbp-0x260], rax[39m
0x4011e7 call 0x4036d0
0x4011ec mov QWORD PTR [rbp-0x278], rax
0x4011f3 call 0x4036d0
0x4011f8 mov QWORD PTR [rbp-0x1b0], rax
0x4011ff call 0x4036d0
[1m[38;5;240m─────────────────────────────────────────────────────────────────────────────────────── [0m[36mthreads[1m[38;5;240m ────[0m
[[32m#0[39m] Id 1, Name: "chal", [31mstopped[39m [34m0x4011e0[39m in [33m??[39m (), reason: [35mBREAKPOINT[39m
[1m[38;5;240m───────────────────────────────────────────────────────────────────────────────────────── [0m[36mtrace[1m[38;5;240m ────[0m
[[32m#0[39m] 0x4011e0 → [31mmov QWORD PTR [rbp-0x260], rax[39m
[[35m#1[39m] 0x83272f → [31mmov edi, eax[39m
[1m[38;5;240m────────────────────────────────────────────────────────────────────────────────────────────────────[0m
[1m[32mgef➤ [0mx/20gx $rax
[34m0x7ffff7ff4040[39m: 0xffffffffffffffff 0x0000000000000000
[34m0x7ffff7ff4050[39m: 0x0000000000000000 0x0000000000000000
[34m0x7ffff7ff4060[39m: 0x0000000000000000 0x0000000000000000
[34m0x7ffff7ff4070[39m: 0x0000000000000000 0x0000000000000000
[34m0x7ffff7ff4080[39m: 0x0000000000000000 0x0000000000000000
[34m0x7ffff7ff4090[39m: 0x0000000000000000 0x0000000000000000
[34m0x7ffff7ff40a0[39m: 0x0000000000000000 0x0000000000000000
[34m0x7ffff7ff40b0[39m: 0x0000000000000000 0x0000000000000000
[34m0x7ffff7ff40c0[39m: 0x0000000000000000 0x0000000000000000
[34m0x7ffff7ff40d0[39m: 0x0000000000000000 0x0000000000000000
[1m[32mgef➤ [0m
We can see that after the call, rax points to some 8 byte region of memory that has been set to -1. The most compelling piece of evidence that this is possibly some sort of malloc call is if you sift through some of the nested function calls, landing you on FUN_00834190, where there’s a clear mmap call being made. This isn’t super rigorous, but we can hold on to this assumption for the timebeing. (Note: this is probably musl’s mallocng implementation. I know this because I have brainworms.)
So our child starts with a bunch of malloc calls, supposedly. This is followed up by a bunch of calls to FUN_004036f0 with those mallocd addresses and the characters of our input as the arguments:
...
  local_2b8[5] = FUN_004036d0();
  local_2b8[3] = 0x40137c;
  uVar6 = FUN_004036d0();
  local_2b8[3] = 0x401390;
  FUN_004036f0(local_268,*puVar10);
  local_2b8[3] = 0x4013a2;
  FUN_004036f0(local_280,puVar10[1]);
  local_2b8[3] = 0x4013b4;
  FUN_004036f0(local_1b8,puVar10[2]);
  local_2b8[3] = 0x4013c6;
  FUN_004036f0(local_1c0,puVar10[3]);
...
This is the function where we encountered our SIGBUS from earlier!
I Don’t Have a Good Bus Joke
Looking at it’s disassembly, we see something interesting:
    undefined FUN_004036f0()
    FUN_004036f0

    ENDBR64
    LEA        EAX,[RSI + -0x1]
    TEST       SIL,SIL
    JZ         LAB_0040372b
    TEST       SIL,0x1
    JZ         LAB_00403718
    MOVZX      R12W,byte ptr [R15 + 0x36]
    LEA        EAX,[RSI + -0x2]
    CMP        SIL,0x1
    JZ         LAB_0040372c
    NOP        dword ptr [RAX]

    LAB_00403718

    MOVZX      R12W,byte ptr [R15 + 0x36]
    MOVZX      R12W,byte ptr [R15 + 0x36]
    SUB        EAX,0x2
    CMP        AL,0xff
    JNZ        LAB_00403718

    LAB_0040372b

    RET

    LAB_0040372c

    RET
Knowing that rsi holds our input character, we see that it essentially calls movzx r12w, byte ptr [r15 + 0x36] the same number of times as the value of the current character, which means we trigger the SIGBUS that same number of times.
This also makes clear why debugging the parent alone will quickly become untenable: for a 30 character input, we will be triggering SIGBUS hundreds of times just in these function calls alone!
Actually, why does this instruction even trigger a SIGBUS?
Since we’re debugging the child, we don’t let the parent trace it and we’ll just hit the SIGBUS ourselves and don’t get to see the after effects of the PTRACE_SETREGS bullshit from earlier.
...
[34m$r12 [39m: [35m0x00007fffffffe20b[39m → [33m"bctf{abcdefghijklmnopqrstuvwxyzABCD}"[39m
[31m$r13 [39m: 0x00007ffff7ff40c0 → 0xffffffffffffffff
[31m$r14 [39m: 0xffffffffffffffff
[36m[=][39m Cannot access memory at address 0x7ffff7ff5000
[34m$r15 [39m: 0x00007ffff7ff5000 → 0x00007ffff7ff5000
[31m$eflags[39m: [[1mZERO[0m carry [1mPARITY[0m adjust sign trap [1mINTERRUPT[0m direction overflow [1mRESUME[0m virtualx86 identification]
[34m$cs[39m: 0x33 [34m$ss[39m: 0x2b [34m$ds[39m: 0x00 [34m$es[39m: 0x00 [34m$fs[39m: 0x00 [34m$gs[39m: 0x00
...
[1m[38;5;240m─────────────────────────────────────────────────────────────────────────────────── [0m[36mcode:x86:64[1m[38;5;240m ────[0m
[1m[38;5;240m 0x40370b cmp sil, 0x1[0m
[1m[38;5;240m 0x40370f je 0x40372c[0m
[1m[38;5;240m 0x403711 nop DWORD PTR [rax+0x0][0m
[32m→ 0x403718 movzx r12w, BYTE PTR [r15+0x36][39m
0x40371e movzx r12w, BYTE PTR [r15+0x36]
0x403724 sub eax, 0x2
0x403727 cmp al, 0xff
0x403729 jne 0x403718
0x40372b ret
[1m[38;5;240m─────────────────────────────────────────────────────────────────────────────────────── [0m[36mthreads[1m[38;5;240m ────[0m
[[32m#0[39m] Id 1, Name: "chal", [31mstopped[39m [34m0x403718[39m in [33m??[39m (), reason: [35mSIGBUS[39m
[1m[38;5;240m───────────────────────────────────────────────────────────────────────────────────────── [0m[36mtrace[1m[38;5;240m ────[0m
[[32m#0[39m] 0x403718 → [31mmovzx r12w, BYTE PTR [r15+0x36][39m
[[35m#1[39m] 0x401390 → [31mmovzx esi, BYTE PTR [r12+0x1][39m
[[35m#2[39m] 0x83272f → [31mmov edi, eax[39m
[1m[38;5;240m────────────────────────────────────────────────────────────────────────────────────────────────────[0m
[1m[32mgef➤ [0mvmmap
[ Legend: [31mCode[39m | [35mStack[39m | [32mHeap[39m ]
[34mStart End Offset Perm Path[39m
0x0000000000400000 0x0000000000401000 0x0000000000000000 r-- /home/jun/shared/Projects/ctfs/boiler/2026/rev/piano/chal
[31m0x0000000000401000[39m [31m0x0000000000835000[39m [31m0x0000000000001000[39m [31mr-x[39m [31m/home/jun/shared/Projects/ctfs/boiler/2026/rev/piano/chal[39m
0x0000000000835000 0x0000000000836000 0x0000000000435000 r-- /home/jun/shared/Projects/ctfs/boiler/2026/rev/piano/chal
0x0000000000836000 0x0000000000838000 0x0000000000435000 rw- /home/jun/shared/Projects/ctfs/boiler/2026/rev/piano/chal
[32m0x0000000000838000[39m [32m0x0000000000839000[39m [32m0x0000000000000000[39m [32m---[39m [32m[heap][39m
[32m0x0000000000839000[39m [32m0x000000000083a000[39m [32m0x0000000000000000[39m [32mrw-[39m [32m[heap][39m
0x00007ffff7ff4000 0x00007ffff7ff5000 0x0000000000000000 rw-
0x00007ffff7ff5000 0x00007ffff7ff6000 0x0000000000000000 rw- /memfd: (deleted)
0x00007ffff7ff6000 0x00007ffff7ff7000 0x0000000000000000 rw- /dev/zero (deleted)
0x00007ffff7ff7000 0x00007ffff7ffb000 0x0000000000000000 r-- [vvar]
0x00007ffff7ffb000 0x00007ffff7ffd000 0x0000000000000000 r-- [vvar_vclock]
[31m0x00007ffff7ffd000[39m [31m0x00007ffff7fff000[39m [31m0x0000000000000000[39m [31mr-x[39m [31m[vdso][39m
[35m0x00007ffffffde000[39m [35m0x00007ffffffff000[39m [35m0x0000000000000000[39m [35mrw-[39m [35m[stack][39m
0xffffffffff600000 0xffffffffff601000 0x0000000000000000 --x [vsyscall]
[1m[32mgef➤ [0m
Notice that r15 contains the address 0x7ffff7ff5000 and even gdb complains that it cannot access the memory there. A look at vmmap shows us that it’s… a deleted memfd region? Woagh! When did that happen?
All the way back in the entry function, we sort of glossed over it a little bit:
void processEntry entry(void)

{
  FUN_00402b10();
  FUN_00832740(FUN_004010b0,*(undefined4 *)register0x00000020,
               (undefined4 *)((long)register0x00000020 + 8),FUN_00401000,FUN_0083484b,0);
  return;
}
FUN_00832740 just looks like a stripped __libc_start_main call, and this whole time we’ve been analyzing FUN_004010b0, so it seemed to check out (Actually, this is the musl implementation of libc_start_main_stage2!). Ghidra is being a little silly with the decompilation, but what’s important is this function call at the end of it:
void FUN_00832740(code *param_1,undefined8 *param_2,undefined8 *param_3)
{
  undefined8 uVar1;
  undefined8 uVar2;
  undefined8 uVar3;
  uint uVar4;
  undefined8 *extraout_RDX;
  undefined8 *puVar5;
  long unaff_RBX;
...
    FUN_00401010();
    param_3 = extraout_RDX;
    register0x00000020 = (BADSPACEBASE *)((long)register0x00000020 + -0x28);
    unaff_RBP = puVar5;
    unaff_R12 = pcVar7;
  } while( true );
}
That call, FUN_00401010, is where our memfd nonsense occurs:
void FUN_00401010(undefined4 param_1)
{
  int __fd;

  FUN_008327f0();
  FUN_00832800();
  FUN_008327f0();
  FUN_008347e0(param_1);
  DAT_00837248 = mmap((void *)0x0,0x1000,3,0x21,-1,0);
  __fd = memfd_create("",0);
  mmap((void *)0x0,0x1000,3,2,__fd,0);
  close(__fd);
  return;
}
This is really cool. Our SIGBUS memory region triggers a SIGBUS rather than a SIGSEGV because after creating the memfd region, we do mmap to it but we don’t make a ftruncate call or anything to actually give the memfd region any physical memory. This means there’s no backing memory to the mmap virtual mapping!
The most important aspect of this is that the memfd address stored in r15 does not get touched, i.e. r15 retains it and (it seems like) every instruction in the child process that tries to R/W to the address stored in r15 will trigger a SIGBUS. This is huge.
Sifting
Actually, so far we’ve established that we’ve got the whole SIGBUS handoff and the weird rt_sigreturn business that the parent appears to establish. We still haven’t really encountered the flagchecking logic…? We continue to stall and waste time anyways by giving the other functions the child calls a quick glance before we setup some Proper Debugging that will let us meaningfully continue with our analysis.
There’s two more functions we see the child call which are repeated, those being FUN_00403730 and FUN_00403750. Both of these functions are almost identical, with the difference lying in the SIGBUS triggering instruction:
    undefined FUN_00403730()
    FUN_00403730

    ENDBR64
    MOV        RAX,qword ptr [RSI]
    CMP        RAX,R14
    JZ         LAB_0040374e
    MOV        RDX,R14
    NOP

    LAB_00403740

    MOVZX      R8D,word ptr [R15 + 0x25]
    MOV        RAX,qword ptr [RAX]
    CMP        RAX,RDX
    JNZ        LAB_00403740

    LAB_0040374e

    RET
The above SIGBUS trigger has instruction bytes 45 0f b7 44 67 25. Recalling our parent handler logic from earlier in FUN_00402c00, this will load 0x403770 into rax and subsequently this process’ rip.
    undefined FUN_00403750()
    FUN_00403750

    ENDBR64
    MOV        RAX,qword ptr [RSI]
    CMP        RAX,R14
    JZ         LAB_0040376d
    MOV        RDX,R14
    NOP

    LAB_00403760

    XOR        BP,word ptr [R15 + 0x27]
    MOV        RAX,qword ptr [RAX]
    CMP        RAX,RDX
    JNZ        LAB_00403760

    LAB_0040376d

    RET
The above SIGBUS trigger has instruction bytes 66 43 33 6f 27. Once again, tracing the parent logic, this will drop us into the other short function, 0x4037a0, when we return execution.
At this point, we’re really starved for some debugging. It’d be nice to see what exactly happens to our child after this SIGBUS back and forth. So how can we overcome the restrictions that nanomites has placed on us?
Quick Emulator Ain’t Not Quick!
Okay so like instead of debugging the process what if we just debugged an entire system. This may seem like a sledgehammer approach to our problem but actually… yeah, no. This is a sledgehammer.
To continue with our debugging adventures, we grab ourselves an Arch Linux ISO, duh.
➜ wget https://geo.mirror.pkgbuild.com/iso/latest/archlinux-x86_64.iso
➜ qemu-system-x86_64 \
    -m 2048 \
    -cdrom archlinux-x86_64.iso \
    -drive file=fat:rw:./share,format=raw \
    -boot d \
    -s -S
Running QEMU with the -s flag will make it listen for a gdb connection on port 1234 and -S will stall QEMU until we’ve attached and tell gdb to continue execution.
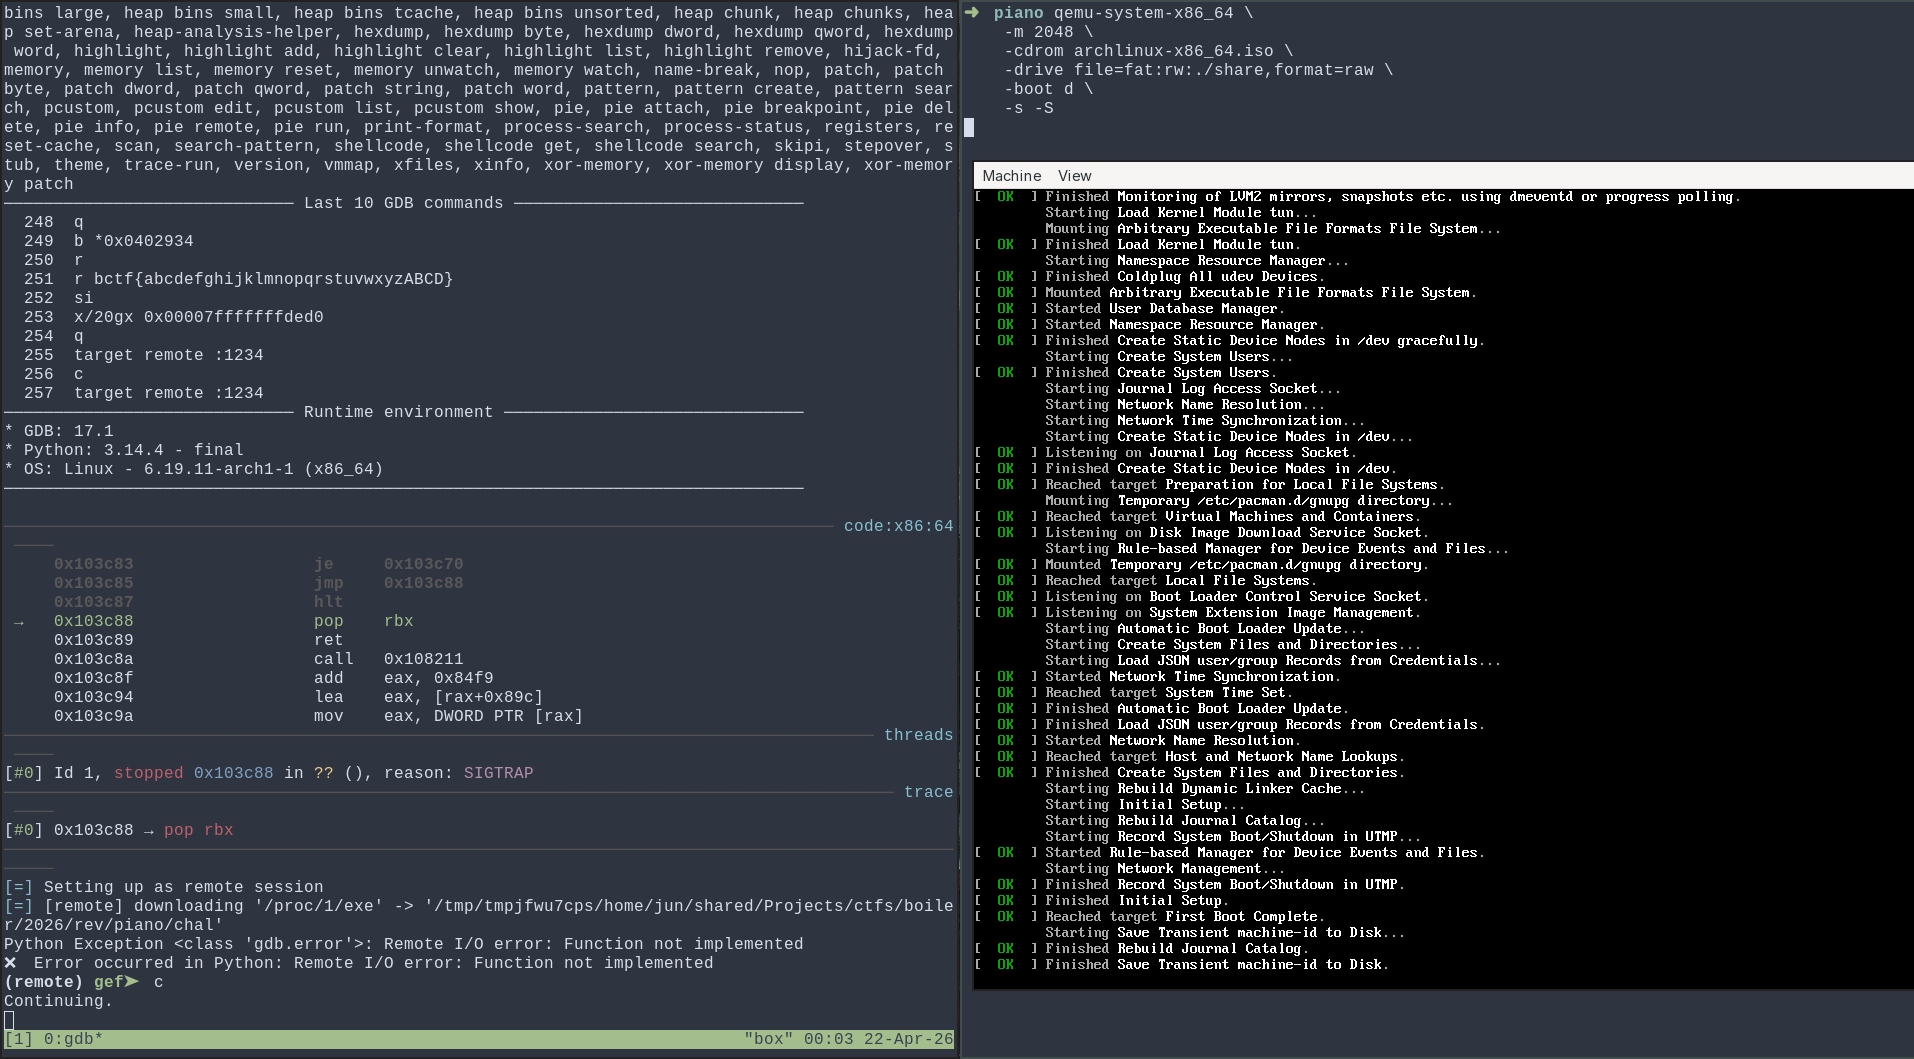 |
|---|
| Fig: I use Arch btw |
Once Arch boots, we copy over the challenge files, and now we’re free to set breakpoints in gdb that will… just work!
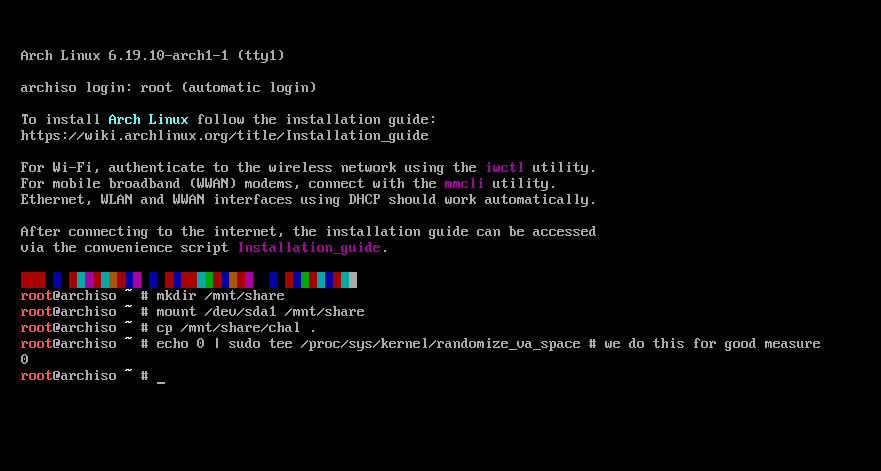 |
|---|
| Fig: Copying over the challenge |
Back in gdb we set a breakpoint for the first 0x4036f0 call in the child process, and we can see that we can successfully step over it without a hitch!
[1m[38;5;240m───────────────────────────────────────────────────────────────────────────────────────── [0m[36mtrace
[1m[38;5;240m ────[0m
[[32m#0[39m] 0xffffffff92df958f → [31mret [39m
[[35m#1[39m] 0xffffffff92dfb689 → [31mnop [39m
[[35m#2[39m] 0xffffffff92dfb918 → [31mcall 0xffffffff92dfa820[39m
[[35m#3[39m] 0xffffffff91dd4818 → [31mjmp 0xffffffff91dd47c2[39m
[1m[38;5;240m───────────────────────────────────────────────────────────────────────────────────────────────
─────[0m
[1m(remote) [32mgef➤ [0mb *0x040138b
Breakpoint 1 at [34m0x40138b[39m
[1m(remote) [32mgef➤ [0m
...
[1m[38;5;240m─────────────────────────────────────────────────────────────────────────────────── [0m[36mcode:x86:64
[1m[38;5;240m ────[0m
[1m[38;5;240m 0x401381 mov rdi, QWORD PTR [rbp-0x260][0m
[1m[38;5;240m 0x401388 mov r8, rax[0m
[31m●[39m [1m[38;5;240m 0x40138b call 0x4036f0[0m
[31m●[32m→ 0x401390 movzx esi, BYTE PTR [r12+0x1][39m
0x401396 mov rdi, QWORD PTR [rbp-0x278]
0x40139d call 0x4036f0
0x4013a2 movzx esi, BYTE PTR [r12+0x2]
0x4013a8 mov rdi, QWORD PTR [rbp-0x1b0]
0x4013af call 0x4036f0
[1m[38;5;240m─────────────────────────────────────────────────────────────────────────────────────── [0m[36mthreads
[1m[38;5;240m ────[0m
[[32m#0[39m] Id 1, [31mstopped[39m [34m0x401390[39m in [33m??[39m (), reason: [35mBREAKPOINT[39m
[1m[38;5;240m───────────────────────────────────────────────────────────────────────────────────────── [0m[36mtrace
[1m[38;5;240m ────[0m
[[32m#0[39m] 0x401390 → [31mmovzx esi, BYTE PTR [r12+0x1][39m
[[35m#1[39m] 0x83272f → [31mmov edi, eax[39m
[1m[38;5;240m───────────────────────────────────────────────────────────────────────────────────────────────
─────[0m
[1m(remote) [32mgef➤ [0m
That’s wonderful. We can now test our assumptions concerning the funny rt_sigreturn business finally by placing a breakpoint on FUN_00403770 and seeing that indeed, FUN_00833cd0 is a malloc call, and what this function is doing is… creating a linked list?
This part of the decompilation elucidates that:
  puVar2 = (undefined8 *)thunk_FUN_00833cd0(8);
  *puVar2 = *param_1;
  *param_1 = puVar2;
Knowing now that puVar2 is the result of malloc(8), we can see that what it does is store the address of the previous malloc into the new malloc’d memory, then update *param_1 to point to this new malloc’d memory.
Also, the rt_sigreturn call does actually behave as expected, returning execution to the calculated incremented rip from the parent’s side
[1m[38;5;240m─────────────────────────────────────────────────────────────────────────────────── [0m[36mcode:x86:64
[1m[38;5;240m ────[0m
[1m[38;5;240m 0x40378e mov QWORD PTR [rbx], rax[0m
[1m[38;5;240m 0x403791 mov rsp, r13[0m
[1m[38;5;240m 0x403794 mov eax, 0xf[0m
[32m→ 0x403799 syscall [39m
0x40379b ud2
0x40379d nop DWORD PTR [rax]
0x4037a0 endbr64
0x4037a4 mov rax, QWORD PTR [rdi]
0x4037a7 mov rcx, QWORD PTR [rax]
[1m[38;5;240m─────────────────────────────────────────────────────────────────────────────────────── [0m[36mthreads
[1m[38;5;240m ────[0m
[[32m#0[39m] Id 1, [31mstopped[39m [34m0x403799[39m in [33m??[39m (), reason: [35mSINGLE STEP[39m
[1m[38;5;240m───────────────────────────────────────────────────────────────────────────────────────── [0m[36mtrace
[1m[38;5;240m ────[0m
[[32m#0[39m] 0x403799 → [31msyscall [39m
[1m[38;5;240m───────────────────────────────────────────────────────────────────────────────────────────────
─────[0m
[1m(remote) [32mgef➤ [0mx/30gx $rsp
[34m0x7ffff7ff6008[39m: 0x0000000000000000 0x0000000000000000
[34m0x7ffff7ff6018[39m: 0x0000000000000000 0x0000000000000000
[34m0x7ffff7ff6028[39m: 0x0000000000000000 0x00007ffff7ff4280
[34m0x7ffff7ff6038[39m: 0x0000000000000000 0x00007ffff7ff440c
[34m0x7ffff7ff6048[39m: 0x00000000000001ec 0x00007fffffffe58e
[34m0x7ffff7ff6058[39m: 0x00007ffff7ff40c0 0xffffffffffffffff
[34m0x7ffff7ff6068[39m: 0x00007ffff7ff5000 0x00007ffff7ff4040
[34m0x7ffff7ff6078[39m: 0x0000000000000062 0x00007fffffffe280
[34m0x7ffff7ff6088[39m: 0x00007ffff7ff40b0 0x0000000000000004
[34m0x7ffff7ff6098[39m: 0x0000000000000061 0x0000000000000080
[34m0x7ffff7ff60a8[39m: 0x00007fffffffdfc8 0x0000000000403724
[34m0x7ffff7ff60b8[39m: 0x0000000000010246 0x0000000000000033
[34m0x7ffff7ff60c8[39m: 0x0000000000000000 0x0000000000000000
[34m0x7ffff7ff60d8[39m: 0x0000000000000000 0x0000000000000000
[34m0x7ffff7ff60e8[39m: 0x0000000000000000 0x0000000000000000
[1m(remote) [32mgef➤ [0m
In this example, our SIGBUS was triggered on the instruction 0x403718, and now we are restoring rip to be 0x403724, an increment of 0x6. So actually, this whole time what we thought was a register struct construction on DAT_00837248 for PTRACE_SETREGS on the parent’s side was actually an SROP frame!
Now that we know triggering FUN_00403770 on our SIGBUS will push a linked list node, it seems like FUN_004036f0 will create a linked list of length c for each character c of the input. Writing a simple gdb function to help us calculate the linked list length confirms this:
[1m(remote) [32mgef➤ [0mdefine get_len
Type commands for definition of "get_len".
End with a line saying just "end".
>set $curr = (unsigned long long)$arg0
>set $count = 0
>while $curr != 0xffffffffffffffff
>set $count = $count + 1
>set $curr = *(unsigned long long *)$curr
>end
>set $count = $count - 1
>printf "Linked list length: %d\n", $count
>end
[1m(remote) [32mgef➤ [0m
...
[1m[38;5;240m─────────────────────────────────────────────────────────────────────────────────── [0m[36mcode:x86:64
[1m[38;5;240m ────[0m
[1m[38;5;240m 0x40137c movzx esi, BYTE PTR [r12][0m
[1m[38;5;240m 0x401381 mov rdi, QWORD PTR [rbp-0x260][0m
[1m[38;5;240m 0x401388 mov r8, rax[0m
[31m●[32m→ 0x40138b call 0x4036f0[39m
↳ 0x4036f0 endbr64
0x4036f4 lea eax, [rsi-0x1]
0x4036f7 test sil, sil
0x4036fa je 0x40372b
0x4036fc test sil, 0x1
0x403700 je 0x403718
[1m[38;5;240m─────────────────────────────────────────────────────────────────────────── [0m[36marguments (guessed)
[1m[38;5;240m ────[0m
0x4036f0 (
[34m$rdi[39m = 0x00007ffff7ff4040 → 0xffffffffffffffff,
[34m$rsi[39m = 0x0000000000000062,
[34m$rdx[39m = 0x0000000000000004,
[34m$rcx[39m = 0x0000000000000080,
[34m$r8[39m = 0x00007ffff7ff4280 → 0xffffffffffffffff
)
[1m[38;5;240m─────────────────────────────────────────────────────────────────────────────────────── [0m[36mthreads
[1m[38;5;240m ────[0m
[[32m#0[39m] Id 1, [31mstopped[39m [34m0x40138b[39m in [33m??[39m (), reason: [35mBREAKPOINT[39m
[1m[38;5;240m───────────────────────────────────────────────────────────────────────────────────────── [0m[36mtrace
[1m[38;5;240m ────[0m
[[32m#0[39m] 0x40138b → [31mcall 0x4036f0[39m
[[35m#1[39m] 0x83272f → [31mmov edi, eax[39m
[1m[38;5;240m───────────────────────────────────────────────────────────────────────────────────────────────
─────[0m
[1m(remote) [32mgef➤ [0m
Here we break on the first call to 0x4036f0 in the child process. Take note of rdi, which is the malloc’d region from earlier, and rsi, which is the character that we’re loading (rsi = 0x62 = 'b').
[1m[38;5;240m─────────────────────────────────────────────────────────────────────────────────── [0m[36mcode:x86:64
[1m[38;5;240m ────[0m
[1m[38;5;240m 0x401381 mov rdi, QWORD PTR [rbp-0x260][0m
[1m[38;5;240m 0x401388 mov r8, rax[0m
[31m●[39m [1m[38;5;240m 0x40138b call 0x4036f0[0m
[31m●[32m→ 0x401390 movzx esi, BYTE PTR [r12+0x1][39m
0x401396 mov rdi, QWORD PTR [rbp-0x278]
0x40139d call 0x4036f0
0x4013a2 movzx esi, BYTE PTR [r12+0x2]
0x4013a8 mov rdi, QWORD PTR [rbp-0x1b0]
0x4013af call 0x4036f0
[1m[38;5;240m─────────────────────────────────────────────────────────────────────────────────────── [0m[36mthreads
[1m[38;5;240m ────[0m
[[32m#0[39m] Id 1, [31mstopped[39m [34m0x401390[39m in [33m??[39m (), reason: [35mBREAKPOINT[39m
[1m[38;5;240m───────────────────────────────────────────────────────────────────────────────────────── [0m[36mtrace
[1m[38;5;240m ────[0m
[[32m#0[39m] 0x401390 → [31mmovzx esi, BYTE PTR [r12+0x1][39m
[[35m#1[39m] 0x83272f → [31mmov edi, eax[39m
[1m[38;5;240m───────────────────────────────────────────────────────────────────────────────────────────────
─────[0m
[1m(remote) [32mgef➤ [0mget_len $rdi
Linked list length: 98
[1m(remote) [32mgef➤ [0m
Stepping over the call, we now see that rdi has a linked list of length 98 = 0x62!
Fill in the Blank
Now that we have better debugging in place and some functions elucidated, we can summarise some of the features so far and start filling in some blanks:
SIGBUSis triggered by the child by accessing a hollowmemfdregion, seemingly through ops against ther15register.- Based on the
SIGBUStriggering instruction, the parent will send the child into eitherFUN_00403770orFUN_004037a0. - We now know that
FUN_00403770pushes to a linked list in the child via amalloccall before resuming execution via SROP. - The flag is reconstructed in the child as linked lists where each list length are the individual character values of the flag.
We should probably look into FUN_004037a0 real quick.
Free Bird
We know that in the child, we have those repeated calls to FUN_00403730 or FUN_00403750, with the latter being known to trigger FUN_004037a0 based on the SIGBUS trigger instruction bytes. So, let’s just set a breakpoint on FUN_004037a0 and observe what it does:
[1m[38;5;240m─────────────────────────────────────────────────────────────────────────────────── [0m[36mcode:x86:64
[1m[38;5;240m ────[0m
[1m[38;5;240m 0x403799 syscall [0m
[1m[38;5;240m 0x40379b ud2 [0m
[1m[38;5;240m 0x40379d nop DWORD PTR [rax][0m
[31m●[32m→ 0x4037a0 endbr64 [39m
0x4037a4 mov rax, QWORD PTR [rdi]
0x4037a7 mov rcx, QWORD PTR [rax]
0x4037aa mov QWORD PTR [rdi], rcx
0x4037ad mov r13, r12
0x4037b0 mov rdi, rax
[1m[38;5;240m─────────────────────────────────────────────────────────────────────────────────────── [0m[36mthreads
[1m[38;5;240m ────[0m
[[32m#0[39m] Id 1, [31mstopped[39m [34m0x4037a0[39m in [33m??[39m (), reason: [35mBREAKPOINT[39m
[1m[38;5;240m───────────────────────────────────────────────────────────────────────────────────────── [0m[36mtrace
[1m[38;5;240m ────[0m
[[32m#0[39m] 0x4037a0 → [31mendbr64 [39m
[[35m#1[39m] 0x401623 → [31mmov rdi, r11[39m
[[35m#2[39m] 0x83272f → [31mmov edi, eax[39m
[1m[38;5;240m───────────────────────────────────────────────────────────────────────────────────────────────
─────[0m
[1m(remote) [32mgef➤ [0mget_len $rdi
Linked list length: 118
[1m(remote) [32mgef➤ [0m
Even looking at the function statically, we can make an educated guess as to what it does. We know that FUN_00403770 is a linked list push operation done with a malloc, and the pseudocode for FUN_004037a0 looks remarkably like a pop operation:
  puVar1 = (undefined8 *)*param_1;
  *param_1 = *puVar1;
  thunk_FUN_00832d30(puVar1);
We can see a dereference to go one node down the linked list, then an update to the pointer. In fact, skimming through FUN_00832d30, we do find a munmap call in FUN_008342c0:
void FUN_008342c0(void *param_1,size_t param_2)
{
  int iVar1;

  FUN_00834180();
  iVar1 = munmap(param_1,param_2);
  FUN_00834800(iVar1);
  return;
}
So FUN_00832d30 is probably the free to our FUN_00833cd0’s malloc! Allowing ourselves to step through the function, we do see that our linked list does get shortened by one node:
[1m[38;5;240m─────────────────────────────────────────────────────────────────────────────────── [0m[36mcode:x86:64
[1m[38;5;240m ────[0m
[1m[38;5;240m 0x4037a4 mov rax, QWORD PTR [rdi][0m
[1m[38;5;240m 0x4037a7 mov rcx, QWORD PTR [rax][0m
[1m[38;5;240m 0x4037aa mov QWORD PTR [rdi], rcx[0m
[32m→ 0x4037ad mov r13, r12[39m
0x4037b0 mov rdi, rax
0x4037b3 and rsp, 0xfffffffffffffff0
0x4037b7 call 0x832840
0x4037bc mov rsp, r13
0x4037bf mov eax, 0xf
[1m[38;5;240m─────────────────────────────────────────────────────────────────────────────────────── [0m[36mthreads
[1m[38;5;240m ────[0m
[[32m#0[39m] Id 1, [31mstopped[39m [34m0x4037ad[39m in [33m??[39m (), reason: [35mSINGLE STEP[39m
[1m[38;5;240m───────────────────────────────────────────────────────────────────────────────────────── [0m[36mtrace
[1m[38;5;240m ────[0m
[[32m#0[39m] 0x4037ad → [31mmov r13, r12[39m
[[35m#1[39m] 0x401623 → [31mmov rdi, r11[39m
[[35m#2[39m] 0x83272f → [31mmov edi, eax[39m
[1m[38;5;240m───────────────────────────────────────────────────────────────────────────────────────────────
─────[0m
[1m(remote) [32mgef➤ [0mget_len $rdi
Linked list length: 117
[1m(remote) [32mgef➤ [0m
Nice. Now that we know that FUN_004037a0 is a linked list pop operation and FUN_00403770 is a linked list push operation, we can fill out what FUN_00403730 and FUN_00403750 do.
Guess We’re Doing O(N) Arithmetic
 |
|---|
| Fig: picrel |
Both of these functions take in two arguments, with them both being some linked list, i.e. some character values from the flag. Here we’ve broken at the first FUN_00403750 call to take a looky:
[1m[38;5;240m─────────────────────────────────────────────────────────────────────────────────── [0m[36mcode:x86:64
[1m[38;5;240m ────[0m
[1m[38;5;240m 0x40160d mov rsi, rdx[0m
[1m[38;5;240m 0x401610 mov QWORD PTR [rbp-0x220], r9[0m
[1m[38;5;240m 0x401617 mov QWORD PTR [rbp-0x1e8], rdx[0m
[31m●[32m→ 0x40161e call 0x403750[39m
↳ 0x403750 endbr64
0x403754 mov rax, QWORD PTR [rsi]
0x403757 cmp rax, r14
0x40375a je 0x40376d
0x40375c mov rdx, r14
0x40375f nop
[1m[38;5;240m─────────────────────────────────────────────────────────────────────────── [0m[36marguments (guessed)
[1m[38;5;240m ────[0m
0x403750 (
[34m$rdi[39m = 0x00007ffff7ff41e0 → 0x00007ffff7fe73d0 → 0x00007ffff7fe73c0 → 0x00007ffff7fe73b0 → 0
x00007ffff7fe73a0 → 0x00007ffff7fe7390 → 0x00007ffff7fe7380 → 0x00007ffff7fe7370,
[34m$rsi[39m = 0x00007ffff7ff4110 → 0x00007ffff7fee2d0 → 0x00007ffff7fee2c0 → 0x00007ffff7fee2b0 → 0
x00007ffff7fee2a0 → 0x00007ffff7fee290 → 0x00007ffff7fee280 → 0x00007ffff7fee270
)
[1m[38;5;240m─────────────────────────────────────────────────────────────────────────────────────── [0m[36mthreads
[1m[38;5;240m ────[0m
[[32m#0[39m] Id 1, [31mstopped[39m [34m0x40161e[39m in [33m??[39m (), reason: [35mBREAKPOINT[39m
[1m[38;5;240m───────────────────────────────────────────────────────────────────────────────────────── [0m[36mtrace
[1m[38;5;240m ────[0m
[[32m#0[39m] 0x40161e → [31mcall 0x403750[39m
[[35m#1[39m] 0x83272f → [31mmov edi, eax[39m
[1m[38;5;240m───────────────────────────────────────────────────────────────────────────────────────────────
─────[0m
[1m(remote) [32mgef➤ [0mget_len $rdi
Linked list length: 118
[1m(remote) [32mgef➤ [0mget_len $rsi
Linked list length: 105
[1m(remote) [32mgef➤ [0mp $r14
[36m$2[39m = 0xffffffffffffffff
[1m(remote) [32mgef➤ [0m
We can see here that with our dummy input bctf{abcdefghijklmnopqrstuvwxyzABCD}, these arguments are flag[26] and flag[13]. Stepping through the assembly, we continually dereference a copy of rsi stored in rax until we hit cmp rax, r14, which is just a check against 0xffffffffffffffff (which is stored in r14):
    undefined FUN_00403750()
    FUN_00403750

    ENDBR64
    MOV        RAX,qword ptr [RSI] ; Load rsi into rax
    CMP        RAX,R14 ; Check if we have hit 0xffffffffffffffff
    JZ         LAB_0040376d ; Terminate if so
    MOV        RDX,R14 ; Load r14 into rdx
    NOP

    LAB_00403760

    XOR        BP,word ptr [R15 + 0x27] ; Trigger SIGBUS, call linked list pop function FUN_004037a0
    MOV        RAX,qword ptr [RAX] ; Dereference rax by one, traversing down the linked list
    CMP        RAX,RDX ; Check if we have hit 0xffffffffffffffff
    JNZ        LAB_00403760 ; Loop otherwise

    LAB_0040376d

    RET
From our understanding of the structs, this means we’ve essentially entered a for loop of the length of rsi, and in this for loop, we are calling FUN_004037a0 on rdi that number of times. In other words… this is an $O(N)$ subtraction function, performing rdi -= rsi. We can confirm this by inspecting the values of rdi and rsi right after the function call:
[1m[38;5;240m─────────────────────────────────────────────────────────────────────────────────── [0m[36mcode:x86:64
[1m[38;5;240m ────[0m
[1m[38;5;240m 0x401610 mov QWORD PTR [rbp-0x220], r9[0m
[1m[38;5;240m 0x401617 mov QWORD PTR [rbp-0x1e8], rdx[0m
[31m●[39m [1m[38;5;240m 0x40161e call 0x403750[0m
[31m●[32m→ 0x401623 mov rdi, r11[39m
0x401626 mov QWORD PTR [rbp-0x1f8], r11
0x40162d call 0x403810
0x401632 mov r12, QWORD PTR [rbp-0x2b0]
0x401639 mov rcx, QWORD PTR [rbp-0x1a8]
0x401640 mov rsi, r12
[1m[38;5;240m─────────────────────────────────────────────────────────────────────────────────────── [0m[36mthreads
[1m[38;5;240m ────[0m
[[32m#0[39m] Id 1, [31mstopped[39m [34m0x401623[39m in [33m??[39m (), reason: [35mBREAKPOINT[39m
[1m[38;5;240m───────────────────────────────────────────────────────────────────────────────────────── [0m[36mtrace
[1m[38;5;240m ────[0m
[[32m#0[39m] 0x401623 → [31mmov rdi, r11[39m
[[35m#1[39m] 0x83272f → [31mmov edi, eax[39m
[1m[38;5;240m───────────────────────────────────────────────────────────────────────────────────────────────
─────[0m
[1m(remote) [32mgef➤ [0mget_len $rdi
Linked list length: 13
[1m(remote) [32mgef➤ [0mget_len $rsi
Linked list length: 105
[1m(remote) [32mgef➤ [0m
Yeah, last I checked 118 - 105 = 13, so this looks correct.
Similarly, the sister function FUN_00403730 triggers push operations, which means it implements $O(N)$ addition, serving as a rdi += rsi function. Verification of this has been left as an exercise to the reader.
Clarity
As it stands, we can also start to think about the flagchecker logic a bit. We now know that this program is just incrementing and decrementing the values of our flag characters. What causes it to fail?
Recall that in the parent’s logic, it will fall to the Wrong block if we hit a SIGSEGV. And what would trigger a SIGSEGV? If we try to call free on 0xffffffffffffffff, or in other words, if we try to decrement a character into a negative number! So it seems like for us to win, we need to ensure that throughout all these additions and subtractions and increments and decrements that we never go negative.
We can quickly simulate this by passing in a dummy flag like bctf{zzzzzzzzzzzzzzzzzzzzzAzzzzzzzz}, which should cause the subtraction we looked at earlier to go negative. We place a breakpoint on 0x4028f7, which is the signal check against SIGSEGV in the parent, and a breakpoint for right after the first subtraction, at 0x401623:
[1m[38;5;240m─────────────────────────────────────────────────────────────────────────────────── [0m[36mcode:x86:64
[1m[38;5;240m ────[0m
[1m[38;5;240m 0x4028ef movzx edx, dh[0m
[1m[38;5;240m 0x4028f2 cmp edx, 0x7[0m
[1m[38;5;240m 0x4028f5 je 0x402915[0m
[31m●[32m→ 0x4028f7 cmp edx, 0xb[39m
0x4028fa je 0x402abd
0x402900 movsxd r10, edx
0x402903 mov edi, 0x7
0x402908 mov rax, r9
0x40290b mov rsi, rbx
[1m[38;5;240m─────────────────────────────────────────────────────────────────────────────────────── [0m[36mthreads
[1m[38;5;240m ────[0m
[[32m#0[39m] Id 1, [31mstopped[39m [34m0x4028f7[39m in [33m??[39m (), reason: [35mBREAKPOINT[39m
[1m[38;5;240m───────────────────────────────────────────────────────────────────────────────────────── [0m[36mtrace
[1m[38;5;240m ────[0m
[[32m#0[39m] 0x4028f7 → [31mcmp edx, 0xb[39m
[[35m#1[39m] 0x83272f → [31mmov edi, eax[39m
[1m[38;5;240m───────────────────────────────────────────────────────────────────────────────────────────────
─────[0m
[1m(remote) [32mgef➤ [0mp $edx
[36m$3[39m = 0xb
[1m(remote) [32mgef➤ [0m
We can see the parent breakpoint hits with a SIGSEGV, and our child’s breakpoint never hit, implying our crash occured within the subtraction function. This may seem non-rigorous, but it’s enough information for us to carry on.
Actually Solving the Challenge
Okay, we now have all the puzzle pieces. We know we’ve got linked list arithmetic, we know our fail condition, all that’s left are the really big functions in the child which we know are also triggering SIGBUS left and right. If we can quickly, grossly generalise the behaviour of these functions, we can then perhaps write a parser to determine what each function is doing, get our constraints and win.
I mean, we only have addition and subtraction to work with, so the functions can’t be that complicated, right?
Actually, I am right.
Generalising the Remaining Child Functions
Let’s do a little eyeballing.
One of the big functions we haven’t analysed yet is FUN_00403810, and the disassembly looks a little like this:
    undefined FUN_00403810()
    FUN_00403810
    MOV        word ptr [R15 + 0x36],CX
    BSF        R10D,dword ptr [R15 + 0x1d]
    SUB        R14,qword ptr [R15 + 0x20]
    MOVZX      RBP,word ptr [R15 + 0x8]
    MOVSX      EBP,word ptr [R15 + 0x42]
    MOVSX      BP,byte ptr [R15 + 0x63]
    MOVZX      RCX,word ptr [R15 + 0x48]
    BSR        R12D,dword ptr [R15 + 0xd]
    MOVZX      R9,byte ptr [R15 + 0x13]
    OR         R8,qword ptr [R15 + 0x3b]
    AND        R10B,byte ptr [R15 + 0x3b]
    MOVSX      EAX,word ptr [R15 + 0x2d]
    ...
Wow… SIGBUS galore… scrolling through the disassembly, every function seems to use r15 as some address, so I’m just going to Assume and Generalise that every single instruction triggers a SIGBUS. And that’s called rigor.
On our end, when we are constructing a parser, we just need to copy the logic from the parent to switch between addition and subtraction based on the instruction bytes. For a function like this, once done it is equivalent to rdi += c for some integer constant c, and we can compute that c easily on our end.
Now it’d be great if all the other functions looked like this, but unfortunately there’s another class of functions to generalise.
Take FUN_00734180 for example:
undefined FUN_00734180()
FUN_00734180

PUSH       RBX
PUSH       R12
PUSH       RBP
MOV        RBX,RDI
PUSH       -0x1
MOV        R12,RSP
MOV        RDI,R12
MOV        RBP,RBX

LAB_00734192

MOV        RBP,qword ptr [RBP]
CMP        RBP,R14
JZ         LAB_007341a3
MOVSX      RSP,byte ptr [R15 + 0x77]
JMP        LAB_00734192

LAB_007341a3

MOV        RBP,RBX

LAB_007341a6

MOV        RBP,qword ptr [RBP]
CMP        RBP,R14
JZ         LAB_007341b7
MOV        word ptr [R15 + 0x41],BP
JMP        LAB_007341a6

...
Okay, I know loops are a bit hard to see with flat disassembly output, but I’m not pulling out radare2 to pretty print this. Just by using our eyes, we can trace rdi going into rbx, then rbx getting loaded into rbp before these loops. We can make an educated guess that we’re looking at some sort of multiplication function, where the number of SIGBUS loop blocks are our multiplier.
How do we differentiate between the two types of functions? Well, it seems like all the multiplication blocks start with push rbx, so we just scan the first byte of the function for 0x53 and call it a day, duh.
Parsing Function Arguments
Now that we have an idea of how we want to stereotype these functions, we can actually get down to parsing them, then eyeballing whether our parser produces the correct results.
We don’t have to write a good parser, we just need to write one that works.
The first course of action is to map our stack variables to the input flag values. Because the author is Evil (jk, love you) the stack variables are not consecutive and we need to keep track of the various displacements the flag characters are being assigned to.
We start writing our capstone script to parse bytes after 0x40137c to skip the malloc calls. Thankfully, for this part of the assembly, even if there is an indirect assignment (e.g. mov rdx, qword ptr [rbp-0x1f0] followed by mov rdi, rdx later), there should only be one rbp displacement mov before each call to FUN_004036f0, so we just keep track of that:
from capstone import *
from capstone.x86 import *

f = open("chal", "rb")
f.seek(0x137c)

md = Cs(CS_ARCH_X86, CS_MODE_64)
md.detail = True
b = f.read(5374)

inp_mapping = {}
inp_mapping[7] = 7 # rbx
inp_mapping[8] = 8 # r13

for ins in md.disasm(b, 0x40137c):
    i = ins.operands
    if ins.address < 0x40160a:
        if ins.mnemonic == 'mov':
            if i[1].type == X86_OP_MEM:
                if ins.reg_name(i[1].mem.base) == 'rbp':
                    inp_mapping[i[1].value.mem.disp-8] = n
                    n += 1
                    if n == 7: n = 9
Here we map the rbp displacement value to the corresponding flag input index. Just to spite me specifically, there is no rbp displacement assigned for flag characters 0x7 and 0x8 and instead the values from rbx and r13 are used, so we just put some dummy values in their place and skip past them in our parser. We parse up to 0x40160a, since we know that is when the calls end.
The next part is keeping track of the arguments going into the various SIGBUS triggering functions. We just need to keep track of the rdi and rsi values, mapping them to the rbp displacements that we have accumulated.
There’s something weird going on with some of these assignments:
...
    MOV        RSI,RCX
    MOV        RDI,R8
    MOV        qword ptr [RBP + local_218],RCX
    MOV        qword ptr [RBP + local_220],R8
    CALL       FUN_00403750
...
Notice how rcx and r8 are loaded into rsi and rdi first, then… loaded into an rbp displacement? During debugging, those displacements are actually the same values that rcx and r8 already possess, and if we back up on the assembly a bit, we can see that those are the prior assignments:
...
    MOV        RCX,qword ptr [RBP + local_218] ; note the assignment of [rbp-0x218] to rcx here
    MOV        RDI,qword ptr [RBP + local_1c0]
    MOV        RSI,RCX
    CALL       FUN_00403730
    MOV        R8,qword ptr [RBP + local_220] ; note the assignment of [rbp-0x220] to r8 here
    MOV        RSI,qword ptr [RBP + local_210]
    MOV        RDI,R8
    CALL       FUN_00403730
    MOV        RSI,qword ptr [RBP + local_2b0]
    MOV        RDI,RBX
    CALL       FUN_00403730
    MOV        RSI,RCX ; rsi = rcx = [rbp-0x218]
    MOV        RDI,R8  ; rdi = r8 = [rbp-0x220]
    MOV        qword ptr [RBP + local_218],RCX ; what the fuck is with this assignment
    MOV        qword ptr [RBP + local_220],R8  ; like, why???
    CALL       FUN_00403750
...
This happens on basically all the invariant register moves. I, uh, have no good theories on why this is done. When parsing, as long as we maintain our register state diligently, this is a non-issue as the displacements are tracked properly. I’m not sure what this would break, it just made me really confused while solving.
Either way, as stated, we can just track our register states and go along our merry way:
...

regs = {}
regs['rbx'] = 7
regs['r13'] = 8

for ins in md.disasm(b, 0x40137c):
    if ins.mnemonic == 'mov':
        i = ins.operands
        if len(i) == 2:
            if i[0].type == X86_OP_REG and i[1].type == X86_OP_MEM:
                if ins.reg_name(i[1].mem.base) == 'rbp':
                    disp = i[1].value.mem.disp - 8
                    # we put our initial mapping stuff here
                    if ins.address < 0x40160a:
                        if disp not in inp_mapping:
                            inp_mapping[disp] = n
                            n += 1
                            if n == 7: n = 9
                    # track displacements stored into registers
                    regs[ins.reg_name(i[0].value.reg)] = disp

            # r to r movement
            elif i[0].type == X86_OP_REG and i[1].type == X86_OP_REG:
                dst = ins.reg_name(i[0].value.reg)
                src = ins.reg_name(i[1].value.reg)
                if src in regs:
                    regs[dst] = regs[src]

    elif ins.mnemonic == 'call' and ins.address >= 0x40160a:
        if len(ins.operands) > 0 and ins.operands[0].type == X86_OP_IMM:
            print(f"# {hex(ins.address)}")
            imm = ins.operands[0].value.imm
            # imm has the function that we're calling
Okay nice, now we just need to deal with function emulation.
Emulating Functions
We’ve already determined FUN_00403730 to be an addition function and FUN_004037a0 to be a subtraction function, so we can fill that in quickly:
...
    if imm == 0x403750: # subtraction
        a = regs.get('rdi')
        b = regs.get('rsi')
        i0 = inp_mapping.get(a)
        i1 = inp_mapping.get(b)
        print(f"flag[{i0}] -= flag[{i1}]")

    elif imm == 0x403730: # addition
        a = regs.get('rdi')
        b = regs.get('rsi')
        i0 = inp_mapping.get(a)
        i1 = inp_mapping.get(b)
        print(f"flag[{i0}] += flag[{i1}]")
...
Then for the constant addition or constant multiplication functions, we do up a quick parser for them:
...

def big_func(addr, idx):
    f.seek(addr-0x400000)
    b_func = f.read(0x40000)
    mul = False
    n_cnt = 0
    if b_func[0] == 0x53: mul = True
    for ins in md.disasm(b_func, addr):
        if mul:
            if "r15" in ins.op_str: n_cnt += 1 # by observation :)
        else:
            if "r15" in ins.op_str: # replicate the parent logic block
                eax = ins.bytes[0]
                esi = len(ins.bytes)
                rdx = eax % esi
                eax = ins.bytes[rdx]
                if eax & 4 == 0:
                    n_cnt -= 1
                else:
                    n_cnt += 1
        if ins.mnemonic == 'ret':
            if mul:
                print(f"flag[{idx}] *= {n_cnt-1}")
            else:
                print(f"flag[{idx}] += {n_cnt-1}")
            return

...
As mentioned earlier, we just use the first byte of the function as our indicator whether we’re looking at constant addition or multiplication. Additionally, we just be lazy with it and just spot for any instructions with r15 in it and call it a day for calculating the multiplier. We can see that it does check out against the debugger!
For example, we calculate FUN_00734180 to be a multiplier of 231 based on the parser, and we can see that it checks out in debugging:
[1m[38;5;240m─────────────────────────────────────────────────────────────────────────────────── [0m[36mcode:x86:64
[1m[38;5;240m ────[0m
[1m[38;5;240m 0x401699 mov rdi, r13[0m
[1m[38;5;240m 0x40169c call 0x403750[0m
[1m[38;5;240m 0x4016a1 mov rdi, QWORD PTR [rbp-0x238][0m
[31m●[32m→ 0x4016a8 call 0x734180[39m
[31m[!][39m Cannot disassemble from $PC
[1m[38;5;240m─────────────────────────────────────────────────────────────────────────── [0m[36marguments (guessed)
[1m[38;5;240m ────[0m
0x734180 (
[34m$rdi[39m = 0x00007ffff7ff41a0 → 0x00007ffff7fed430 → 0x00007ffff7fed420 → 0x00007ffff7fed410 → 0
x00007ffff7fed400 → 0x00007ffff7fed3e0 → 0x00007ffff7fed3d0 → 0x00007ffff7fed3c0,
[34m$rsi[39m = 0x00007ffff7ff4180 → 0x00007ffff7feeb40 → 0x00007ffff7feeb30 → 0x00007ffff7feeb20 → 0
x00007ffff7feeb10 → 0x00007ffff7feeb00 → 0x00007ffff7feeaf0 → 0x00007ffff7feeae0,
[34m$rdx[39m = 0xffffffffffffffff,
[34m$rcx[39m = 0x00007ffff7ff4200 → 0xffffffffffffffff,
[34m$r8[39m = 0x00007ffff7ff4280 → 0x00007ffff7fea020 → 0x00007ffff7fea010 → 0x00007ffff7fea000 → 0x
00007ffff7fe9ff0 → 0x00007ffff7fe9fe0 → 0x00007ffff7fe9fd0 → 0x00007ffff7fe9fc0
)
[1m[38;5;240m─────────────────────────────────────────────────────────────────────────────────────── [0m[36mthreads
[1m[38;5;240m ────[0m
[[32m#0[39m] Id 1, [31mstopped[39m [34m0x4016a8[39m in [33m??[39m (), reason: [35mBREAKPOINT[39m
[1m[38;5;240m───────────────────────────────────────────────────────────────────────────────────────── [0m[36mtrace
[1m[38;5;240m ────[0m
[[32m#0[39m] 0x4016a8 → [31mcall 0x734180[39m
[[35m#1[39m] 0x83272f → [31mmov edi, eax[39m
[1m[38;5;240m───────────────────────────────────────────────────────────────────────────────────────────────
─────[0m
[1m(remote) [32mgef➤ [0mget_len $rdi
Linked list length: 65
[1m(remote) [32mgef➤ [0m
Here we break right before the call, and right after:
[1m[38;5;240m─────────────────────────────────────────────────────────────────────────────────── [0m[36mcode:x86:64
[1m[38;5;240m ────[0m
[1m[38;5;240m 0x40169c call 0x403750[0m
[1m[38;5;240m 0x4016a1 mov rdi, QWORD PTR [rbp-0x238][0m
[31m●[39m [1m[38;5;240m 0x4016a8 call 0x734180[0m
[31m●[32m→ 0x4016ad mov rdi, QWORD PTR [rbp-0x1b8][39m
0x4016b4 call 0x73dd80
0x4016b9 mov rsi, QWORD PTR [rbp-0x1a8]
0x4016c0 mov rdi, QWORD PTR [rbp-0x280]
0x4016c7 call 0x403730
0x4016cc mov rdi, QWORD PTR [rbp-0x1b0]
[1m[38;5;240m─────────────────────────────────────────────────────────────────────────────────────── [0m[36mthreads
[1m[38;5;240m ────[0m
[[32m#0[39m] Id 1, [31mstopped[39m [34m0x4016ad[39m in [33m??[39m (), reason: [35mBREAKPOINT[39m
[1m[38;5;240m───────────────────────────────────────────────────────────────────────────────────────── [0m[36mtrace
[1m[38;5;240m ────[0m
[[32m#0[39m] 0x4016ad → [31mmov rdi, QWORD PTR [rbp-0x1b8][39m
[[35m#1[39m] 0x83272f → [31mmov edi, eax[39m
[1m[38;5;240m───────────────────────────────────────────────────────────────────────────────────────────────
─────[0m
[1m(remote) [32mgef➤ [0mget_len $rdi
Linked list length: 15015
[1m(remote) [32mgef➤ [0m
Yup, 65 * 231 = 15015 as expected. Why is there an off-by-one error in my code? Probably because my code is garbage.
Anyways, with this we can dump all the constraints of the challenge, or rather, the equations along the way:
    # 0x40161e
    flag[26] -= flag[13]
    # 0x40162d
    flag[30] += 218
    # 0x401646
    flag[28] -= flag[20]
    # 0x40165c
    flag[29] += flag[28]
    # 0x40166f
    flag[14] -= flag[17]
    # 0x40167e
    flag[16] += flag[8]
    # 0x401691
    flag[26] += flag[24]
    # 0x40169c
    flag[8] -= flag[20]
...
    # 0x40283d
    flag[32] += -24709
    # 0x402849
    flag[33] += -32229
    # 0x402855
    flag[34] += -451
    # 0x402861
    flag[35] += -49449
At the very end of all the constraints, we have a bunch of flag[i] -= c equations, so we probably just need it that those values at the end are equal to zero. By our understanding, they actually just have to be non-zero? But it’s probably better if they just landed on zero.
Constraint Solving
Now the thing is we’re not dealing with simple constraints here. You might want to just chuck this into z3, but the problem lies in the fact that once you turn this into a symbolic expression, the values are constantly changing with each operation.
As such, we need to make it a little fugly? Recall that our win condition is that on every equation, the value never drops below zero. We will first create symbolic variables for our input flag:
import z3

orig_flag = [z3.Int(f"f{i}") for i in range(36)]
s = z3.Solver()

for f in orig_flag:
    s.add(f >= 32)
    s.add(f <= 126)

s.add(orig_flag[0] == ord('b'))
s.add(orig_flag[1] == ord('c'))
s.add(orig_flag[2] == ord('t'))
s.add(orig_flag[3] == ord('f'))
s.add(orig_flag[4] == ord('{'))
s.add(orig_flag[-1] == ord('}'))
But for all the assignment/reassignment/constant addition/constant multiplication that we’re doing down the line, we’re going to create a copy of the variables so that we can have the original untouched characters but also the rapidly changing formulae that we’re generating. We accomplish this with a helper function:
flag = list(orig_flag)
def assign(flag, idx, expr, solver):
    flag[idx] = expr
    solver.add(expr >= 0)

# 0x40161e
assign(flag, 26, flag[26] - flag[13], s)
# 0x40162d
assign(flag, 30, flag[30] + 218, s)
# 0x401646
assign(flag, 28, flag[28] - flag[20], s)
# 0x40165c
assign(flag, 29, flag[29] + flag[28], s)
# 0x40166f
assign(flag, 14, flag[14] - flag[17], s)
...
So when we dump the constraints from our parser, we have it dump out assign function calls, which will help us update the flag expression at each step and, most importantly, adds the constraint that each running expression is >= 0.
Then for our last few constraints, we instead fix them to equal to zero:
def assign2(flag, idx, expr, solver):
    flag[idx] = expr
    solver.add(expr == 0)

# 0x4026c9
assign2(flag, 0, flag[0] + -19947, s)
# 0x4026d5
assign2(flag, 1, flag[1] + -36338, s)
# 0x4026e1
assign2(flag, 2, flag[2] + -15136, s)
# 0x4026ed
assign2(flag, 3, flag[3] + -17102, s)
# 0x4026f9
assign2(flag, 4, flag[4] + -48722, s)
# 0x402705
assign2(flag, 5, flag[5] + -6273, s)
# 0x402711
assign2(flag, 6, flag[6] + -1602, s)
# 0x402719
assign2(flag, 7, flag[7] + -34918, s)
# 0x402721
assign2(flag, 8, flag[8] + -431, s)
# 0x40272d
assign2(flag, 9, flag[9] + -44585, s)
...
res = s.check()
print(res)

if res == z3.sat:
    model = s.model()
    print("satisfiable")
    result = ''.join([chr(model.eval(c).as_long()) for c in orig_flag])
    print(result)
Yes, I named it assign2 because I was too fucking lazy to batch rename. Anyways, this is enough! We run the z3 script and get… this:
➜  piano python solve.py
sat
satisfiable
bctf{b#fqQZ*OEQAZKTDAYyl6VPRomVPRom}
Um, a bit of a yucky flag. Regardless, we pass it into the binary, and it clears!
➜  piano ./chal "bctf{b#fqQZ*OEQAZKTDAYyl6VPRomVPRom}"
Correct!
Flag: bctf{b#fqQZ*OEQAZKTDAYyl6VPRomVPRom}.
This is the final parser script and this is the final constraint script.
Conclusion
I really like this challenge. To summarise all the tricks we saw in this one challenge:
- Semi-unconventional syscalls
- Parent-Child debugging/Nanomites
SIGBUStriggering with a badmemfdregion- Stripped
muslfunctions in the form ofmalloc,free - Small antidecompilation tricks like suspect control flow
- SROP, for some fucking reason
- Linked lists as numbers for $O(N)$ arithmetic
I wouldn’t want to speculate what the solve counts would look like in a pre-Codex pre-Clod pre-Gemini world but I’m glad I tackled this challenge the old-school way: by staring at structs for really long and making nonsensical assumptions.
Hopefully you had fun reading this writeup and a big thanks to the Purdue b01lers team for yet another stellar competition!